Unifying data intelligence, Azure models, and Power BI resources for a global workforce.
Role & Team
-
Senior UX Designer
Lead for Research & Design Stream
-
Team Structure
1 Design Lead, Me (Senior UX), 1 Visual Senior, 3 Juniors
-
Responsibility
Led UX Strategy, Core Wireframing & Prototyping, Mentored Juniors
The Context
Starbucks possesses a world-class data infrastructure, utilizing tools ranging from Azure ML models to Power BI reports. However, these resources operated in silos. A Data Scientist in Seattle might build a model that a team in London had already perfected, simply because there was no unified way to see what existed.
The Goal
To transform EDAP from a static file repository into a dynamic "Internal Data Marketplace." The objective was to create a centralized ecosystem where 5,000+ employees could discover, share, and reuse data assets.
From Ambiguity to Alignment
Instead of jumping into UI, I initiated a strategy of "Co-Creation." We realized that for this platform to succeed, it couldn't just be a tool for data scientists; it had to be designed with them.
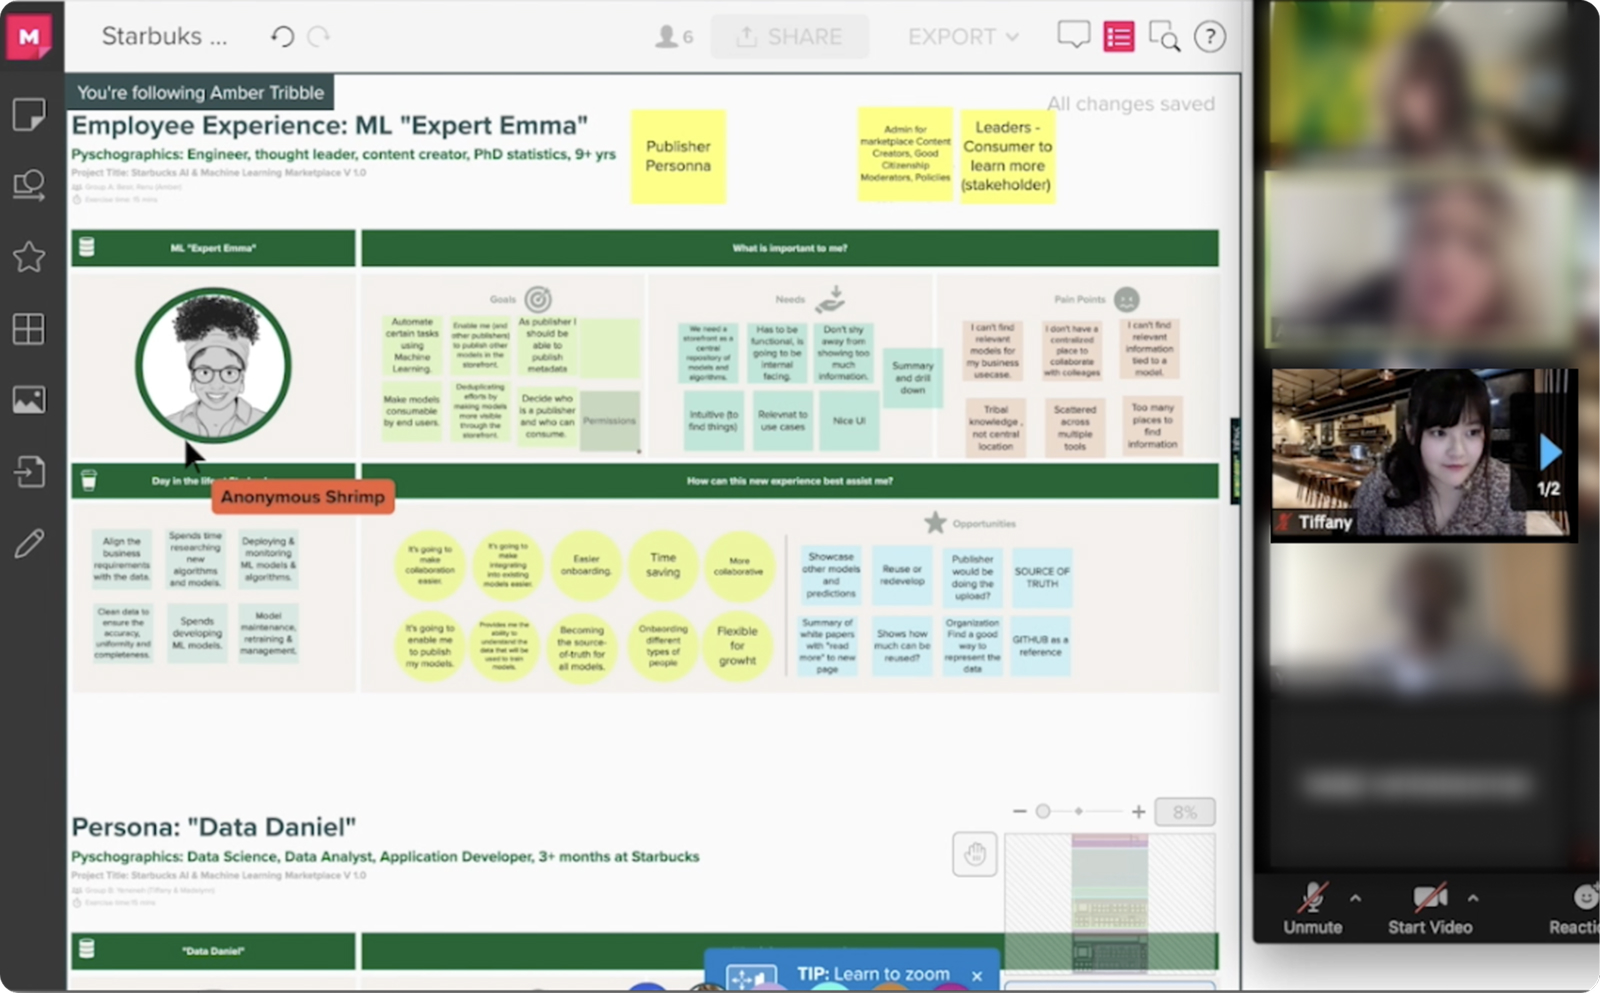
Key Insight: Trust is the Barrier
Our research using Empathy Maps and User Journeys revealed that "Trust" was the biggest barrier. Users wouldn't download a data model unless they knew exactly who owned it and how it was built.
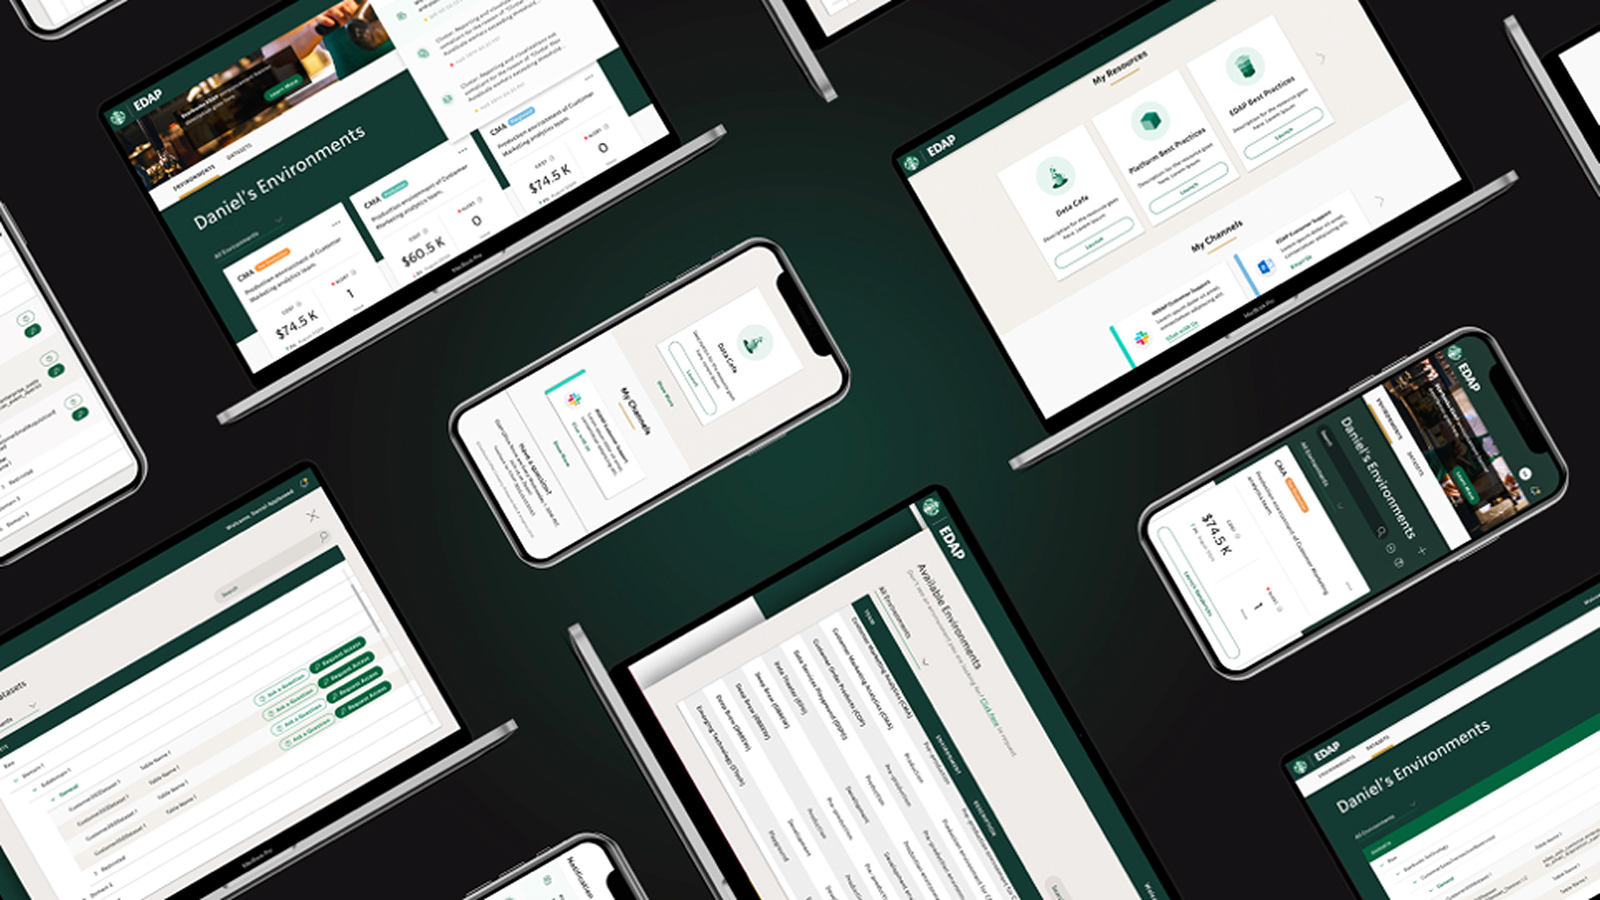
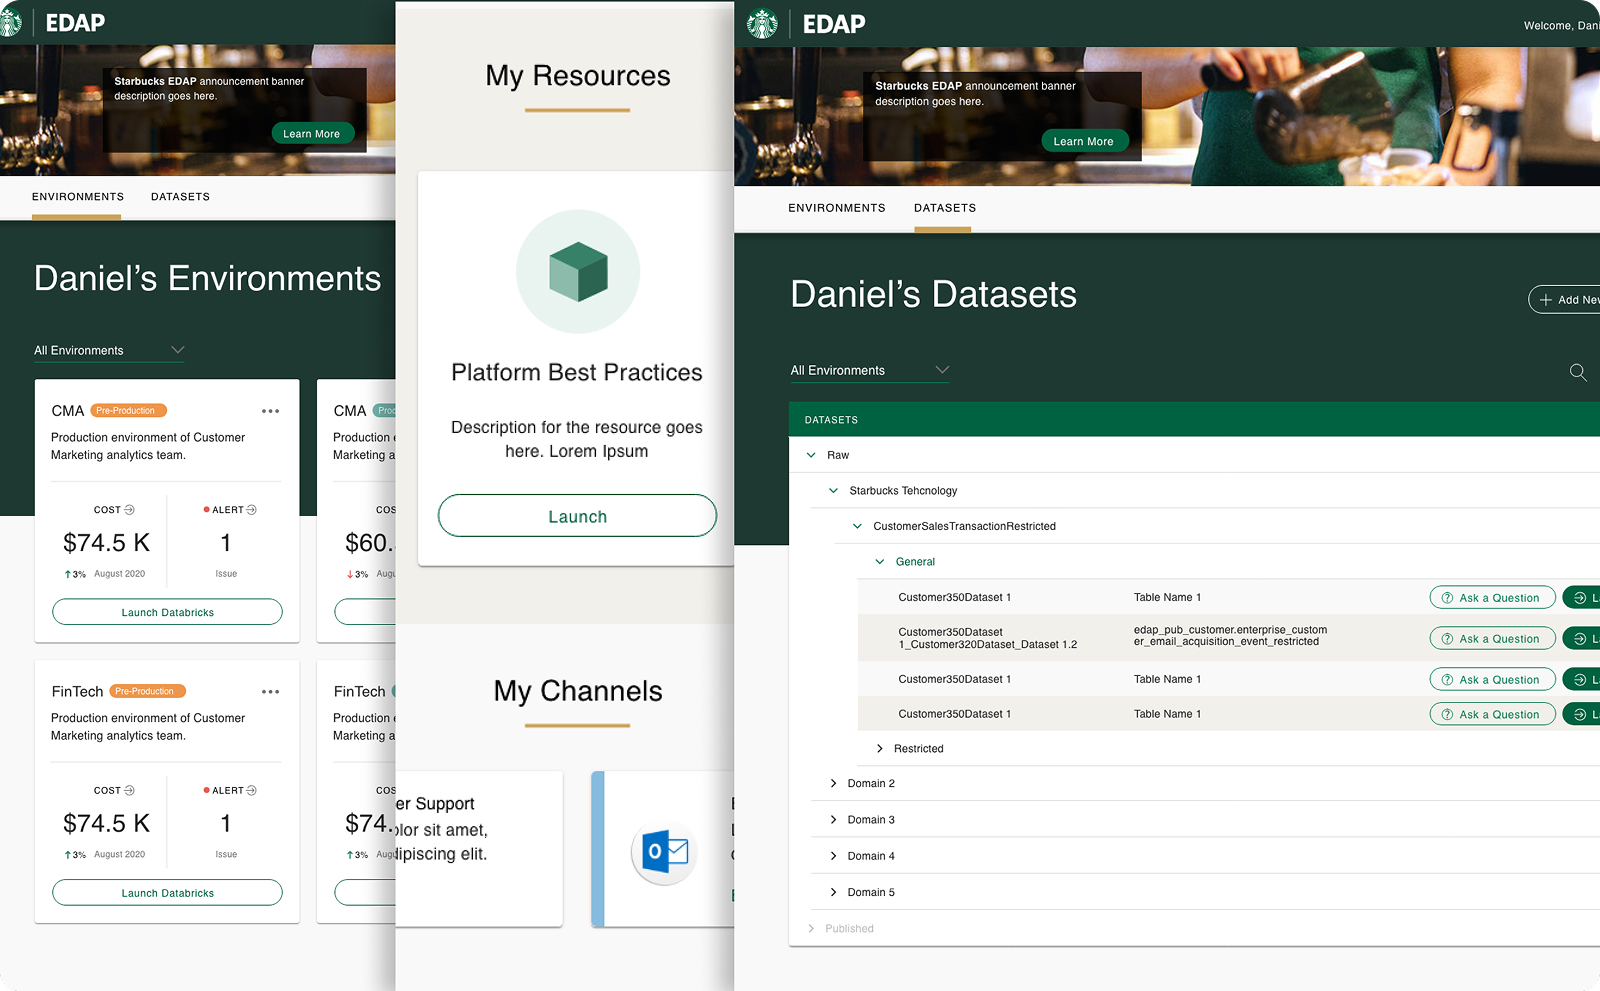
A Unified Ecosystem
Seamless Cross-Platform Integration
Connecting the Ecosystem: Azure, Power BI & Internal Channels.
We positioned EDAP as the "Central Hub." The design integrates disparate resources into a single interface. Users can query once and retrieve results from Azure, Power BI, and internal Channels.
- Unified Search across platforms
- Deep Linking to reduce friction
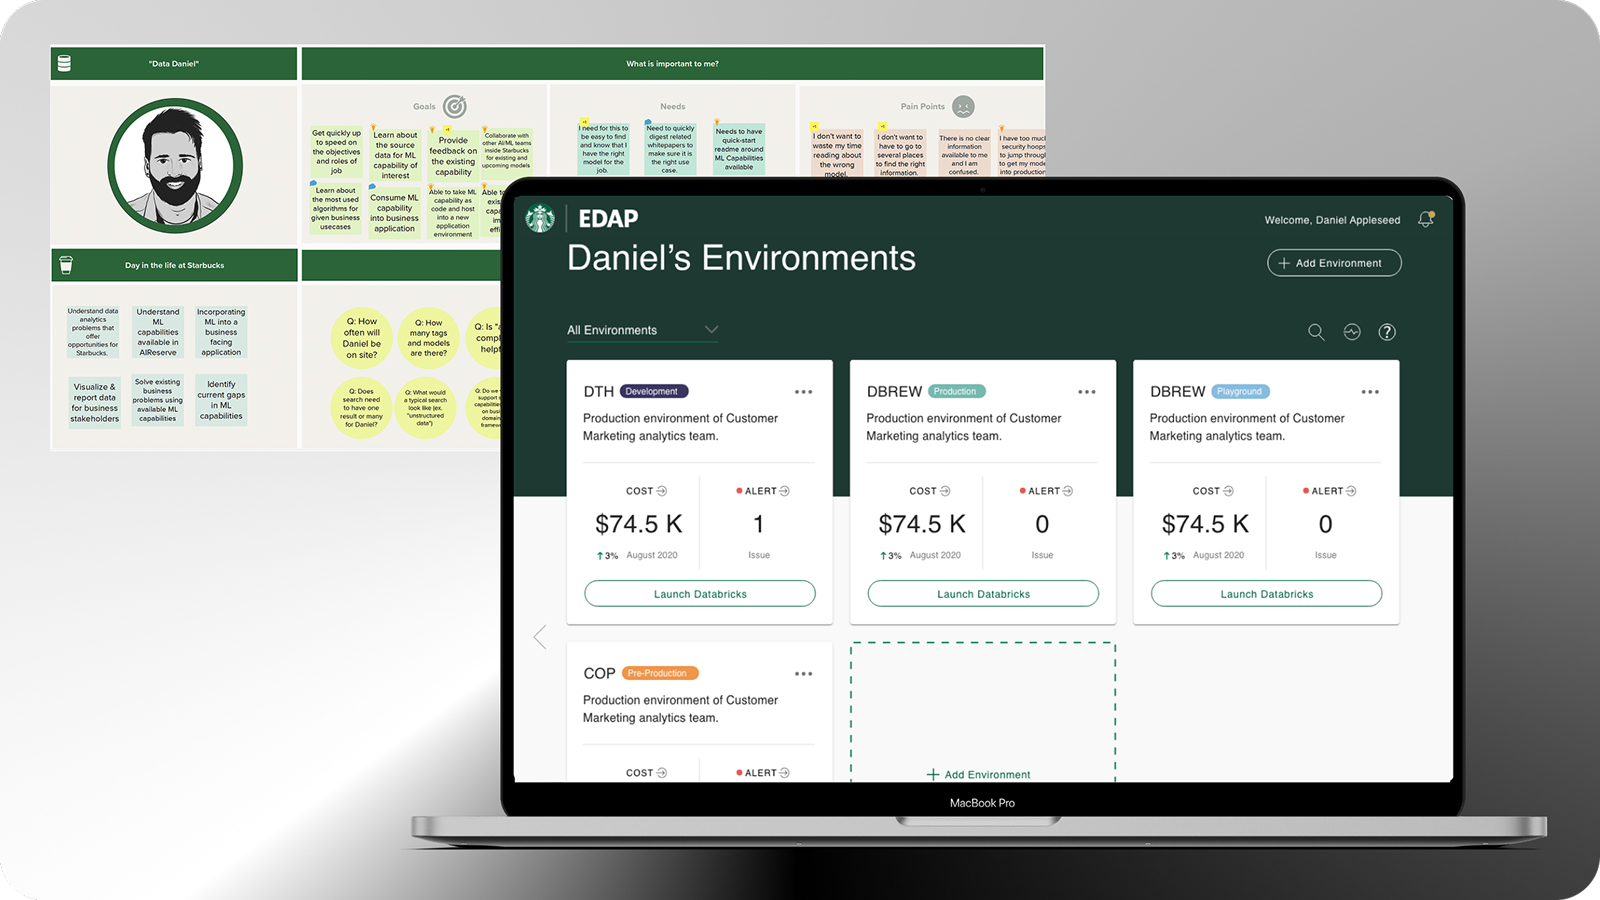
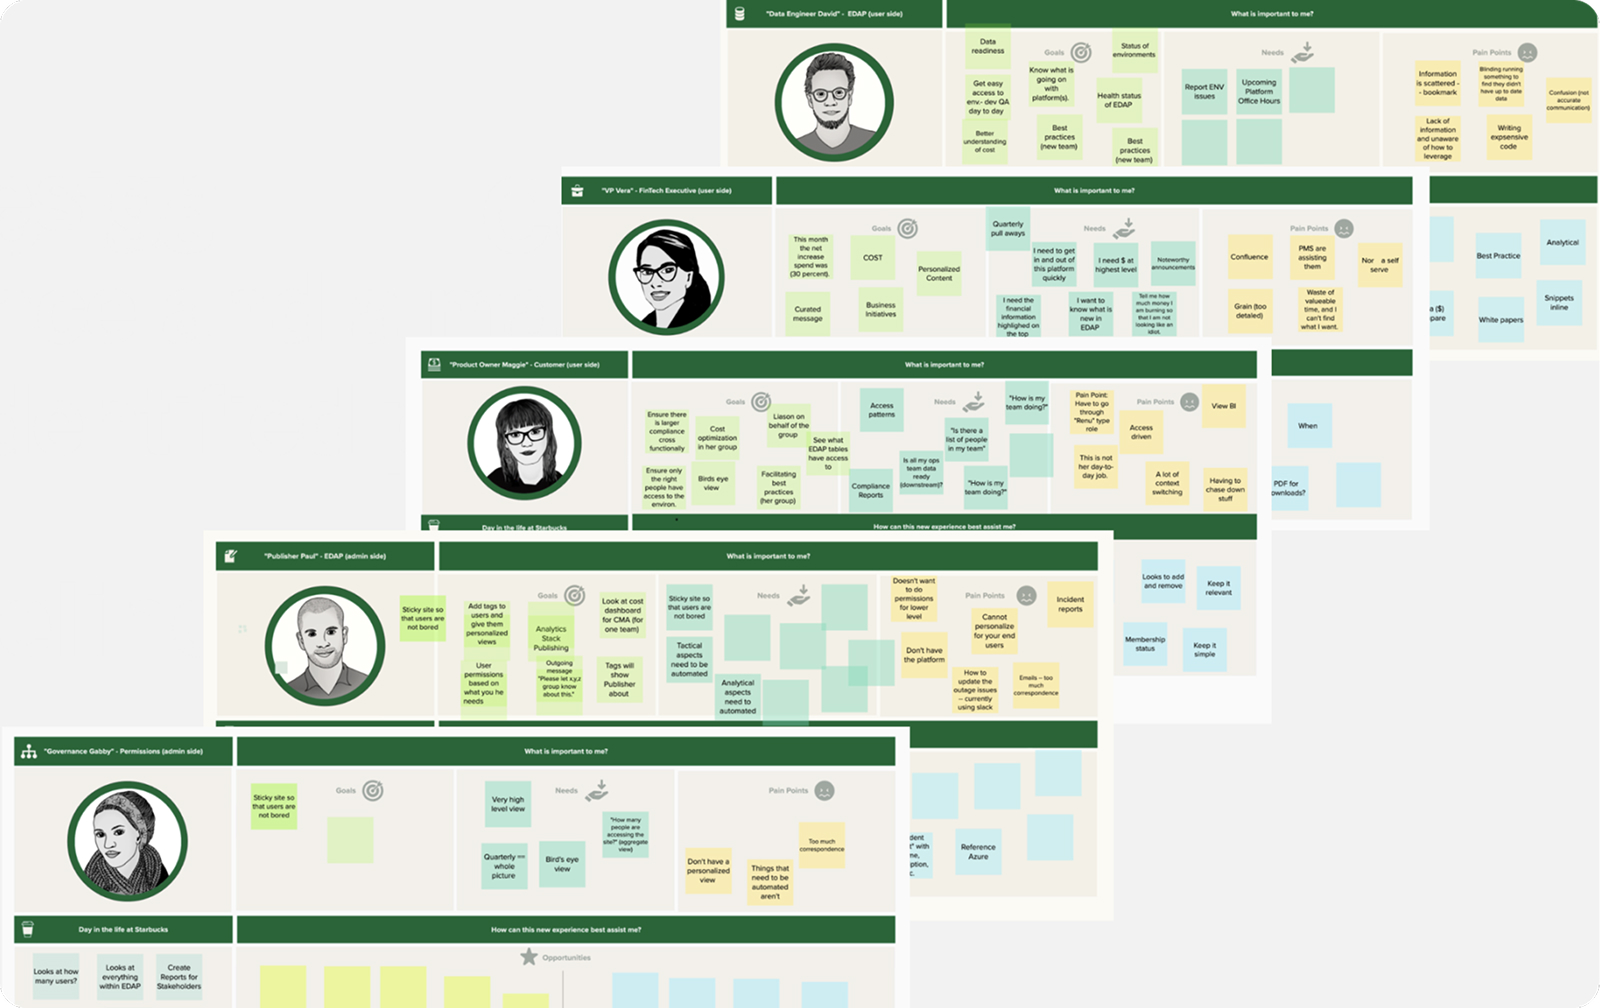
Role-Based Smart Dashboard
Personalized Context for Every Persona.
Recognizing that a Developer and a Marketing Director have different mental models, the dashboard detects the user's role upon login to deliver personalized context.
PERSONALIZATION
Technical roles see API docs; Business roles see high-level analytics.
Anywhere Access
Breaking the Desktop Chain.
Breaking the desktop chain. We transformed the legacy desktop-only tool into a fully responsive web application. Stakeholders can now approve data access requests directly from their phones.
Design Evolution: From Chaos to Clarity
We restructured the Information Architecture from 6 confusing categories to 4 intent-based sections, significantly reducing cognitive load.
Outcomes & Impact
Validated Usability
Usability testing with 32 participants showed that the majority could successfully complete core workflows (search, access, download) without assistance.
Streamlined Discovery
Restructured IA significantly reduced time-on-task. Users reported a much smoother, intuitive search experience compared to the fragmented legacy workflow.
Dev-Ready Handoff
Bridged the gap between design and code with a scalable Design System, empowering the engineering team to begin implementation immediately.
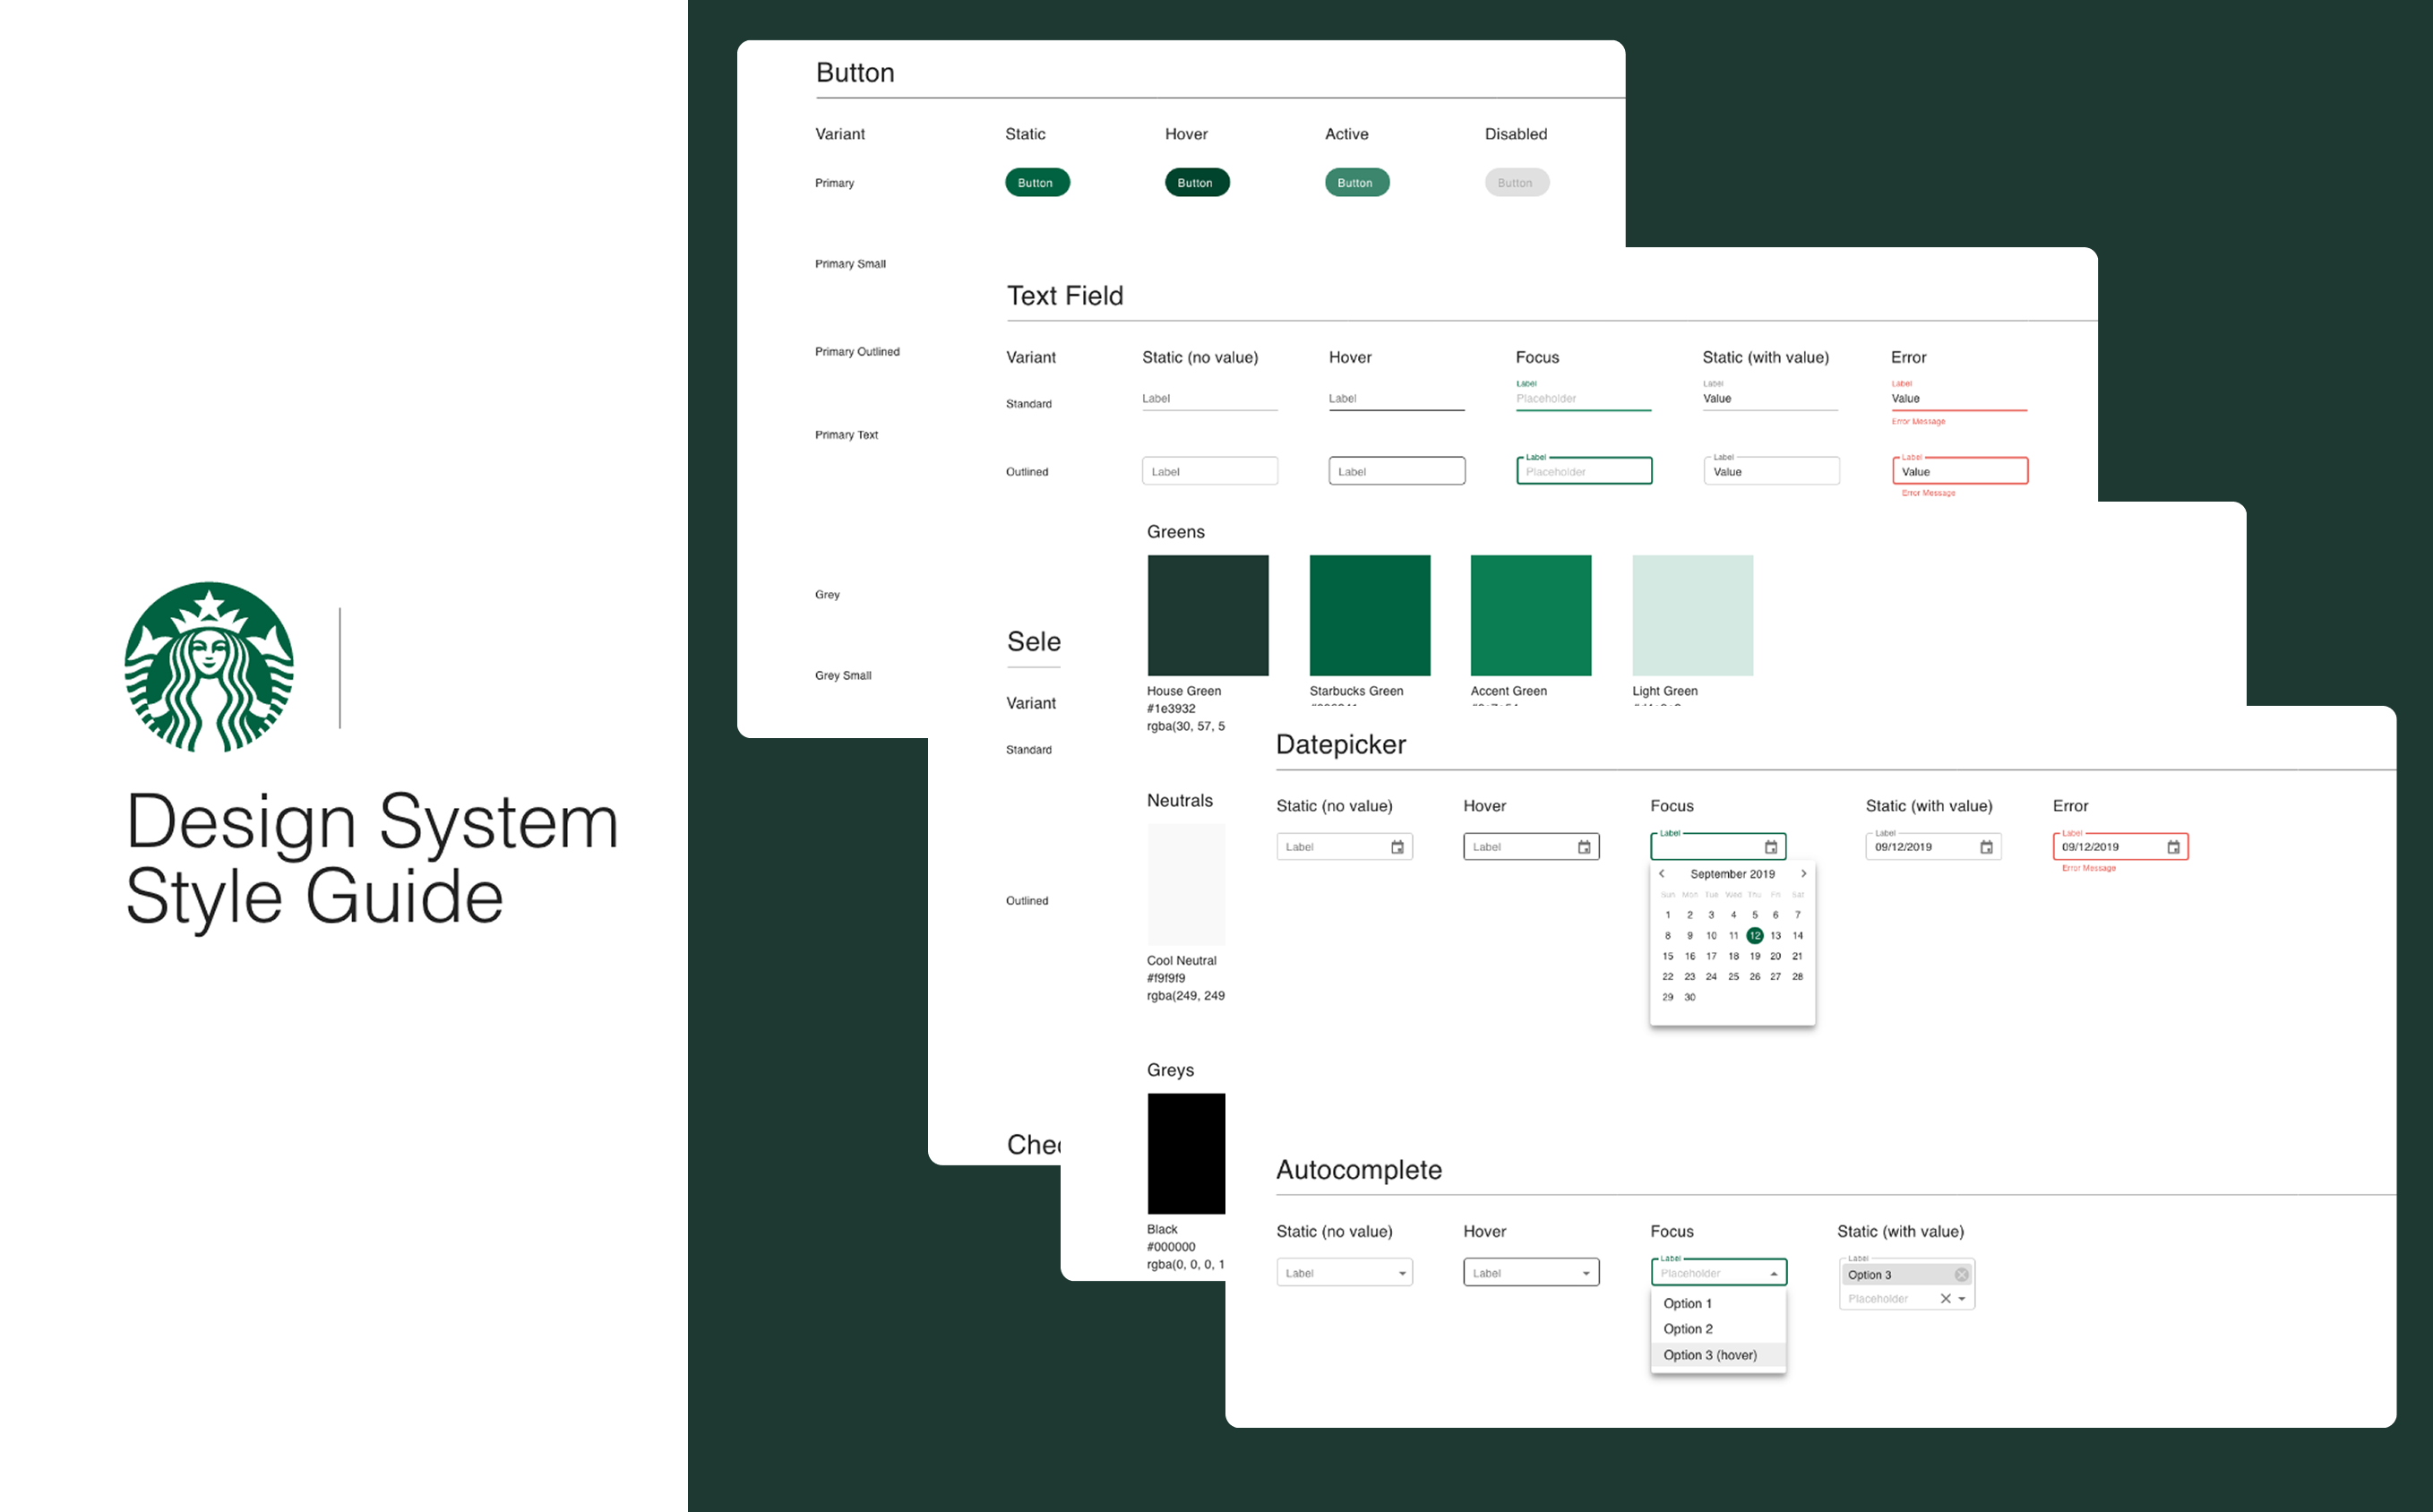
Scalable Design System
We didn't just design screens; we built a language. The "Brew UI" system includes 40+ atomic components, standardized tokens for Azure data visualization, and comprehensive documentation.
The Final Experience
Future Roadmap
Next Step: Full Customization. While the MVP focused on smart defaults, my long-term vision includes customizable workspaces where power users can drag-and-drop widgets to create their own command center.